
Taipei, February 19, 2009 -- Since the consumer demand freeze caused by the global economic downturn and the financial crisis in 2H08, the DRAM quarterly average spot and contract prices both dropped over 40% QoQ. According to the new survey statistics done by DRAMeXchange, the WW DRAM revenue of Q408 also declined 40% QoQ. In Q408, the DDR2 667Mhz 1Gb chip price dropped from 12.5 USD at the beginning of October to its low 0.58 USD in mid December, with a 54% dropping range. In the contract market, the DDR2 1GB module price dropped from 13.5 USD in early October to 8 USD, the degree of dropping reached 40%. Besides, after DRAM vendors cut their capacities from September, the Q4 WW DRAM wafer started declining to only 1.2 million wafers, decreased 20% while comparing to Q3. On the foreign exchange side, the depreciation of Korean won and appreciation of Japanese yen also affected the calculation of DRAM revenue drop. All these factors had influenced the Q4 DRAM vendor revenues.
DRAMeXchange has compiled 2 WW DRAM vendor ranking tables. The main table “Figure 1.” is the revenue ranking by DRAM vendor own brand (remark 1). The second table “Figure 2.” is based on the fab manufacturing basis (remark 2).
1. Analyzing the own brand memory revenue of DRAM vendors, Korean maker Samsung was still at first position. But under the influence of an almost 40% contract price drop, the Samsung Q4 revenue declined 43.1% (Korean won depreciated 28% QoQ in Q4, the Samsung Q4 DRAM revenue only decreased 25% in terms of Korean won). The Q4 Hynix revenue declined 38.6% in terms of USD (18% decline in terms of Korean won). The Micron fiscal quarter was September, October, and November therefore its chip average price was higher than other vendors and the Q4 revenue drop was far less than other DRAM vendors. Its market share increased from 16.9% of Q3 to 11.7% of Q4. In Q4, Qimonda still accounted for 8% WW DRAM market share, but Qimonda announced filing bankruptcy protection in January 23rd, at the same time, it also stopped its OEM relationships with Inotera and Winbond, and closed its U.S. fabs. The DRAM market share will sharply decline in Q109.
On the Taiwanese vendor side, because of the capacity cut effect, the over 50% spot price drop, and rising inventory level in Q4, the revenues of PSC and Promos declined 73.6% and 55.6% respectively. (Figure. 1)
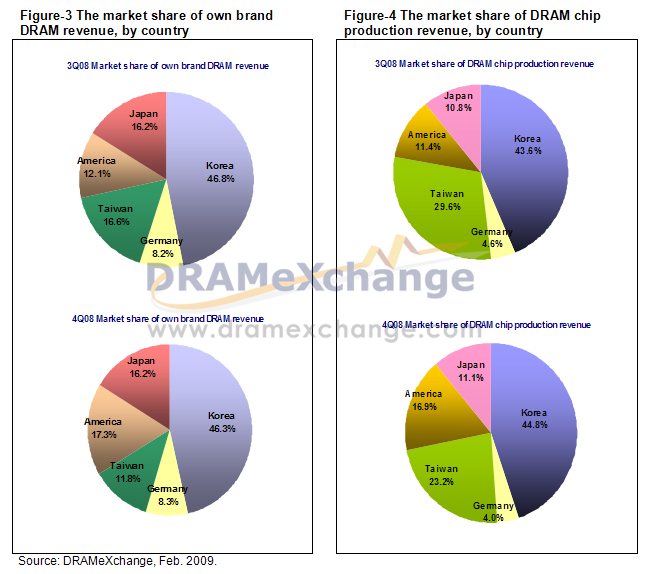
While analyzing from the market share by countries, the Korean vendors were still the winners of the industry with 46.3% market share. Due to the capacity cut issue, the market share of Taiwanese vendors decreased from 16.2% of Q3 to 11.8% of Q4, the drop was about 4.4%. The U.S. vendor and Japanese vendor market shares were 17.3% and 16.2% respectively. (Figure. 3)
|
Figure-1 4Q08 WW top 10 DRAM revenue ranking, by own brand DRAM revenue (Company revenue includes outsourced portion and excludes thesub-manufacturing revenue)
|
Figure-2 4Q08 WW top 10 DRAM revenue ranking, by DRAM chip production revenue(Company revenue includes sub-manufacturing revenue and excludes the outsourced portion)
|
||||||||||||
|
rank
|
company
|
Revenue
|
Market Share
|
rank
|
company
|
Revenue
|
Market Share
|
||||||
|
4Q08
|
3Q08
|
QoQ
|
4Q08
|
3Q08
|
4Q08
|
3Q08
|
QoQ
|
4Q08
|
3Q08
|
||||
|
1
|
Samsung
|
999
|
1,758
|
-43.1%
|
24.5%
|
25.5%
|
1
|
Samsung
|
999
|
1,708
|
-41.5%
|
24.5%
|
24.8%
|
|
2
|
Hynix
|
843
|
1,373
|
-38.6%
|
20.7%
|
19.9%
|
2
|
Hynix
|
830
|
1,300
|
-36.1%
|
20.4%
|
18.9%
|
|
3
|
Micron
|
689
|
808
|
-14.7%
|
16.9%
|
11.7%
|
3
|
Micron
|
689
|
788
|
-12.5%
|
16.9%
|
11.4%
|
|
4
|
Elpida
|
643
|
1,086
|
-40.8%
|
15.8%
|
15.8%
|
4
|
Elpida
|
452
|
744
|
-39.2%
|
11.1%
|
10.8%
|
|
5
|
Qimonda
|
330
|
550
|
-40.0%
|
8.1%
|
8.0%
|
5
|
Inotera
|
250
|
346
|
-27.6%
|
6.1%
|
5.0%
|
|
6
|
Nanya
|
177
|
390
|
-54.6%
|
4.3%
|
5.7%
|
6
|
Nanya
|
212
|
657
|
-67.7%
|
5.2%
|
9.5%
|
|
7
|
ProMOS
|
111
|
250
|
-55.6%
|
2.7%
|
3.6%
|
7
|
Rexchip
|
182
|
250
|
-27.3%
|
4.5%
|
3.6%
|
|
8
|
Powerchip
|
78
|
294
|
-73.6%
|
1.9%
|
4.3%
|
8
|
Qimonda
|
163
|
314
|
-48.2%
|
4.0%
|
4.6%
|
|
9
|
Winbond
|
67
|
113
|
-40.5%
|
1.6%
|
1.6%
|
9
|
ProMOS
|
126
|
300
|
-58.0%
|
3.1%
|
4.3%
|
|
10
|
Etron
|
38
|
64
|
-41.2%
|
0.9%
|
0.9%
|
10
|
Winbond
|
100
|
136
|
-27.0%
|
2.4%
|
2.0%
|
|
|
Others
|
104
|
207
|
-49.6%
|
2.6%
|
3.0%
|
|
Powerchip
|
77
|
350
|
-78.1%
|
1.9%
|
5.1%
|
|
|
Total
|
4,080
|
6,893
|
-40.8%
|
100.0%
|
100.0%
|
|
Total
|
4,080
|
6,893
|
-40.8%
|
100.0%
|
100.0%
|
Subject
Related Articles
Related Reports